Friday, December 21, 2012

Do Consumers Benefit from Energy Efficiency Regulations?


I have a new working paper with Xiaomei (Barbara) Chen, an NCSU graduate student who is on the job market this year, and Larry Dale and Hung-Chia Yang of Lawrence Berkeley National Laboratory.  LBL does a lot of work on energy efficiency regulations, and they asked us to do some data analysis to accompany new energy efficiency standards that were being proposed by the Department of Energy.  They had already done a lot of engineering analysis that typically goes along with these rules. But OMB was looking for an historical account of past standards, particularly the last time DOE increased standards for washers in 2007.  This paper comes out of that work.

This is a new area of research for me, and this paper could use some additional analysis if we can obtain the right data to do it. But even without that data, I think it presents some fairly compelling evidence that energy efficiency regulations may be beneficial in ways not typically considered

Here's the jist of it:  

We obtained a big dataset that tracks sales of all washing machines sold at a large fraction of retailers throughout the country.  These are proprietary data that LBL had to purchase, so unfortunately we cannot share the raw data.  They are monthly data that start well before a 2007 increase in the stringency of clothes washer efficiency standards and continue until well after 2007.  Importantly, the standards change only banned the manufacture, not the sale, of low efficiency washers. 

Unsurprisingly, we found prices of the banned low-efficiency units started increasing a bit before the ban took effect as supplies dwindled.  Price increases and falling quantities continued awhile after the ban. People who really wanted the old, less-efficient washers were clearly worse off because the old washers became more expensive and probably more difficult to find.  

As people shifted their purchases away from the banned units and toward the more efficient units, sales of the efficient units soared.   One may normally expect prices for high-efficiency units to also rise as demand shifted.  But they didn’t.  Instead prices fell sharply around the time of the policy change, just as sales started to rise.  Even if we look only at washers sold both before and after the policy change, the price declines of the efficient washers was larger the price increases of the less efficient washers. And while overall quality of washers increased, average prices declined.  Thus, not counting public and private benefits from energy saving, it seems pretty clear that consumers gained substantially from the policy change.

All of these effects become much clearer when we include washer model fixed effects to control changes in the mix of washers available on the market.

How could it be that regulation of the washer market—imposition of minimum efficiency standards—could cause average washer prices to fall?  The answer, we believe, goes back to a theoretical paper by Ronnen from 1991.  If there are economies of scale in production, as there are likely to be in most manufacturing (cost per unit declines as quantities scale up), then cost of producing efficient washers fell as demand and production increased. 

The question then becomes, why weren’t the more efficient washers simply sold on a larger scale before the policy change?  I think the likely answer to that is imperfect competition and associated price discrimination.  Appliance manufacturers develop a large variety of washers and try to carve out as many niche markets as possible, thereby obtaining some pricing power within each niche market.  These niche's become exaggerated if there is a lot of brand loyalty by consumers.  If there is too much variety, this can be very inefficient, especially if there are large economies of scale.  The end result is too many low-quality washers and too few high-quality washers.  When the policy banned low-efficiency units, it effectively banned low-quality washers and caused greater competition and economies of scale in the high-efficiency/high-quality market.

Note that I’m making a small leap by equating energy efficiency with quality, but the data generally seem to support this, as there is a strong association between price and efficiency, especially before the policy change. 

Now, one important caveat to this study is that other things were going on around the time of the policy change.  Some of the demand shift could have been driven by a spike in energy prices.  Also, the Great Recession began not long after the policy change, but I don't see how that could have caused a shift in demand toward higher-efficiency washers.  In both cases, since the substitution toward efficient washers began a bit before these nearly concurrent events, I think the fairest interpretation is that the policy change was the primary cause.  And even if the policy change wasn’t the cause, the pattern of price changes still suggests significant economies of scale and thus a potential role for policy given a monopolistically competitive market for appliances.

If our hypothesis is correct, we should be able to replicate the result for other appliances and standard changes.  We'll see…

Thursday, December 20, 2012

Rest in Peace Jon Brandt, 1947-2012

As many readers of this blog may already know, Dr. Jon Brandt, Chair of my former department, NCSU's Agricultural and Resource Economics, died just after Thanksgiving.

His passing was a devastating blow and a big surprise to me and everyone I've spoken to about it.  He seemed to be the healthiest mid-60s man I knew.

Jon had a long and decorated career, but I knew him mainly as my boss.  It's often said that chairing an academic department is like herding cats, because academics can have large egos and sharply contrary views and opinions.  Yet Jon did this happily, and to the apparent satisfaction of everyone, for a record 20 years.   I certainly appreciated his support during a delicate period in my career.

A special purpose fund is being developed by the AAEA (kudos to Barry Goodwin) to fund an annual Jon Brandt Policy Forum in case anyone would like to contribute.

Saturday, November 24, 2012

Random Snippets

Apologies for thin posting.  Lots in the air, even more than usual, and this blog sits low on the priority list.

A few brief thoughts below.  Maybe more on these later.

Macro Observations

Stocks and homes look like an incredibly good buy.  Price to earnings ratios for stocks and price to rent ratios for homes are around historic averages.  But prices are a lot better than average because the opportunity cost, reflected in interest rates, are at historic lows.  Put it all together an stocks and houses haven't looked so cheap in at least 60 years.

Housing and broader economic recovery.  Prices are finally rising nationwide, as are housing starts.  We appear to have a shortage of homes for an economy at full employment.  Thus, we should expect building to resume to at least historic norms soon.  That should bring back a lot of construction jobs.  Add a modest multiplier, consumer confidence with higher home equity and portfolio values, could bring about a virtuous cycle that could have our economy humming in another year or two.  This is the basic story Bill McBride's charts show, and he's been right on just about everything this past business cycle.  It pays to pay attention to the data.

ARMs safer than fixed-rate mortgages.  Conventional wisdom, past and present, has always been than a 30-year fixed-rate mortgage is safer than a variable rate mortgage.  That may be true depending on your definition of safe.  An ARM may seem risky given rates could spike and your mortgage payments could go up.  But if you've taken finance and digested the basic lessons of portfolio theory, you know that you need to think about how risks covary with other investments.  Then consider that the only way mortgage rates could spike is if we have real recovery in the economy (no, Greece is not a  likely possibility for us [1, 2]).  With real recovery, your wages, savings and home value are likely to go up with your mortgage payment and it should be easy to manage.  Alternatively, rates could fall in the event the economy stagnates (see Japan).  If this happens you could be stuck in your 30 year mortgage because your home value falls and you cannot refinance at the lower rate.  I don't mean to give financial advice here---you have your own expectations---but I'm pretty sure an ARM is the less risky thing to do.


Political Stuff

Nate Silver: Was awesome to behold this election.  Sam Wang deserves a lot of credit too.  Statistics wonks like me wonder why Nate Silver and Sam Wang had similar predictions but very different confidence intervals for their predictions.  In my own experience, I find it very easy to underestimate standard errors and very hard to overestimate them.  This, plus Nate Silver's occasional quips about the kinds of subtle error correlations he accounts for (e.g., parenthetical note in second paragraph below the map here), make me lean in his direction over Sam Wang.  On the other hand, Sam Wang is a lot more transparent about his model. He evens posts his Matlab code.  Hmmmmm...

Vacuum in the middle: With Tea Partiers displacing moderate Republicans and the Blue Dog Democrats retiring, we seem to have a vacuum in the middle.  This seems to confound basic models of political economy.  There would seem to be a big incentive for a small coalition of Republicans amass extraordinary power by thumbing their nose at Gover Norquist and taking a big step toward the center. After all, this elections proved that the power of money is limited and slapping backs with Obama can pay handsome rewards (Chris Christy's spike in approval).  It's hard to see Republicans maintaining their tight coalition.


Academic pursuits

Fixed effects gone bad:  It's fashionable in empirical economics to run regressions with giant data sets and a zillion fixed effects to control for unobserved factors or isolate a particular "source of identification." This is easy to do.  But if it's done in a thoughtless manner, bad things can happen.  This is an over-arching theme of our comment on Deschenes and Greenstone coming out in in the American Economic Review next month (finally).

Supply and Demand:  My paper with Wolfram Schlenker wherein we identify global supply and demand elasticities for food commodities using weather and yield surprises was recently accepted as a full-lenth article in AER.  There are some substantive revisions since the NBER working paper, but no major new insights.  This is probably my best academic contribution to date.


Personal stuff

Michelle and I have just adopted a son from South Korea. It's the best Holiday gift ever--we are in love already.  No pictures because it really won't be official until the home study is done.  The other big news item is that I've taken leave from NC State and have accepted a position at the University of Hawaii at Manoa.

Aloha and Happy Holiday.

Thursday, September 27, 2012

A bad GDP revision that's actually good

So today they released a revised GDP growth rate for the Spring quarter that was 1.3%, down from an initial estimate of 1.7%.  The revision was blamed mainly on the heat/drought that devastated crop production in the Midwest.

Now, that crop devastation was bad news for the world as a whole, but I'm not so sure it was bad for the narrow interests of the US. We're the world's largest exporter of staple food commodities, and commodity prices went up a whole lot as a result of the losses. Further, those higher crop prices will stick around at least until next year, boosting farm incomes considerably.  So, ironically, the U.S. is probably better off as a result of a bad harvest. Real GDP doesn't reflect the price benefit of exports because real GDP holds prices fixed at a baseline level, so it just measures the physical losses of the crop.

This is quite unusual, I think, for a downward revision of this magnitude to actually be a good thing.  But let me emphasize again:  that's good for the US, not the world as a whole.

Anyhow, since the revision really had to do with the weather and not general recovery, probably only helps the financial position of people living here, and the revision in job counts was all positive, I'm not surprised the stock market went up.

Monday, September 24, 2012

Is what's good for you also good for the planet?

In an OpEd today, Dean Ornish reviews some of the science about eating healthy.  Ornish is famous for curing heart disease through diet and lifestyle change rather than with drugs or bypass surgery.  He's also famous for challenging the Atkins diet, which may help some people lose weight, but is still unhealthy.

Anyhow, one sentence in his OpEd struck me because I think it's what many people presume be true, but I'm not sure whether it really is.  Here it is, in context:
WHAT you eat is as important as what you exclude — your diet needs to be high in healthful carbs like fruits, vegetables, whole grains, legumes, soy products in natural, unrefined forms and some fish, like salmon. There are hundreds of thousands of health-enhancing substances in these foods. And what’s good for you is good for the planet.
[my emphasis]

I'm sure Ornish is right about what's really healthy.  But is it true that what's good for you is good for the environment?  I'd guess he's referring mainly to meat consumption, especially fatty red meat.  Red meat is bad for you and can be costly in the sense that it takes more caloric energy to sustain animals than if one were to consume whole grains, and cut animals out of the picture.

As a first cut, this seems right.  But we are also quite efficient and producing corn and soybeans for animal feed, and we've grown amazingly efficient (some might say inhumane) in the way we raise animals so as to minimize their movement and caloric consumption and thus maximize conversion of feed grains into meat.

And so I wonder: if we were to eat more fruits, vegetables, whole grains and fish, would that ultimately be better for the planet?  For one, I rather doubt we're nearly as efficient producing calories from fruits and vegetables as we are from corn and soybeans.  Grass-fed, free-range beef may be healthier than corn-fed beef, but it may well be worse for the planet, because it generally uses more land and resources.  And we have all kinds of challenges with sustainably harvesting and farming fish.

Anyway, there is a subculture (organic, eat local, grass-fed animals, etc.) that often goes hand-in-hand with the culture of eating more whole grains, fresh fruits and veggies, fish, etc.  This culture seems to  presume these foods are not only the healthier but also better for the environment.  In some cases this is probably true; in other cases it's probably not.  It's a question that probably deserves more scrutiny.

Friday, September 21, 2012

Discount rates and inequality

The other day I commented about the importance and ambiguity of discount rates when estimating the social cost of CO2 emissions.

One key issue that it seems resource/environmental economists have largely ignored is the link between inequality and discount rates.

First, some more background.  To focus cleanly on tradeoffs over time, nearly all the work in this area uses a representative-agent model that imagines society as a mythical aggregated individual deciding how much to consume today versus tomorrow. Within these models, equilibrium interest rates (i.e., discount rates) are intimately tied to consumption growth, which we imagine to be roughly equal to growth in GDP per capita.  Since historically that growth has been steady, leaders in environmental economics, including luminaries like William Nordhaus and Robert Pindyck, prefer the use of higher discount rates because they presume our ancestors descendents will be so much richer than we are.  Even Weitzman, who prefers very low discount rates, uses the representative agent model.

There are many ways in which these representative agent models oversimplify the world.  That simplification is feature, not a bug---it's necessary for getting our collective heads around tough problems.

But here's a particular rub with the representative agent model: while GDP growth generally has a steady upward trajectory (recent experience exempted), median consumption, income and wealth seems to have flatlined in the U.S. since the 1970s.  Extrapolating from that, it's hard to imagine most of our ancestors descendents necessarily being much better off than we are.

Now, it's true that interest rates are more reasonably tied to growth in the mean or the aggregate sum than to growth in the median.  But I think the fact that growth has not been and is unlikely to be anywhere near equal over the next 30 to 100 years should give us some pause.

We need more careful work connecting inequality with long-run discount rates, especially when thinking about the right price for greenhouse gas emissions.

Wednesday, September 19, 2012

Following Ben's lead

So Japan, seeing the boom in US stocks and the decline in the dollar with Ben Bernanke's QE3, decides to do the same.  After all, Japan has been struggling with a near deflationary economy for two decades, and what the Fed just did was what economists have been saying Japan should do for a long time.

Now, with the dollar and yen falling relative to the euro, it's going to put more pressure on the European Central Bank.  If ECB doesn't loosen as well, the strength of the euro will hamper their exports, and putting headwinds on their already stagnating economy.

And so I expect it may go.  Now that the U.S. is pushing harder on monetary policy, I think others will too, all the more if it seems to be working.

Inflation here we come.  I don't mean hyperinflation; I mean an extra point or two or three more inflation not this year or perhaps even next year, but in two or three years.  And this may be enough to get consumption and investment going again in the nearer term.

Discount rates and the social cost of carbon

Joanna Foster at the New York Times Green Blog discusses how discount rates affect estimates of the social cost of carbon---the "price" we all would have to pay for emissions to bring them down to an efficient level.  A new study suggests we should use a lower discount rate, which indicates much higher carbon prices.  Michael Greenstone, who led a study by the President's CEA, seemed to think the rate his study used was just fine.

A little background:  There are many assumptions that go into estimating the social cost of carbon.  We need to think about impacts of climate change on sea level rise, agriculture, coral reefs, fisheries, recreation, human health and on and on, each of which is controversial in its own right.  But the biggest overarching assumption is, by far, the choice of discount rate, which coverts projected future benefits and costs into today's dollars.

The starting point for thinking about discount rates is to look at real interest rates, which equal nominal rates minus expected inflation.  In theory, real rates should be tied, first and foremost, to projected economic growth.  The idea is that the richer we become, the less we will value additional wealth, and so the more we'd prefer a dollar today when we are relatively poorer over a dollar tomorrow when we expect to be relatively richer.

So, if we expect our offspring to be much richer than we are, we should use a higher discount rate and a much lower price of carbon, because our descendents will be able to absorb the costs climate change much more easily than we can afford preventing the change. If we expect little growth, the discount rate should be lower, the price of carbon emissions would be higher, and we should work harder now to reduce emissions.

Using data to project long-run real interest rates is difficult because we don't have particularly good measures in history, since nominal rates combine expectations about inflation and future real rates.  But since the late 1990s, we can observe long-run real rates on inflation-indexed treasury bills. These rates are now at the lowest in history, and if we had inflation-indexed bonds going back to the 1960s, today might still be the lowest.  From FRED, here's the available history of 5, 10 and 30-year inflation indexed bonds.


The old saw in economics is that baseline real growth is on the order of 2 percent per year.  That rate also roughly matches the data for 10-year rates prior to crisis.  Since then, however, real rates have steadily declined and are now firmly negative for 5-year and 10-year rates, while the 30-year rate is at about 1/2 %.

I see two ways to interpret these data.  One is that this is just what happens in a really bad recession, and in the long run we'll pull out of this and get back to 2% real rates.  Another is that expectations about growth have become a lot more dismal.  After all, the 30-year rates mostly cover a period well beyond current business-cycle considerations, and even these are relatively tiny 1/2%.

(Incidentally, the sharp decline at the end, especially for the 5-year, was the intended effect of Fed's recent action)

My guess is that the combination of these two things like  explain the low rates: this is still a bad recession and expectations about the long-run future have declined as well.

Anyhow, to the extent that we believe long-run rates are down because expectations for long-run growth are down, and that these rates are accurate reflections of the future, I'd say the discount rates used in pricing carbon emissions are probably too high.

The question is, where's the rethink in policy analysis given rates have fallen so much in recent years?

Consider:  the 30-year rate above, at 1/2%, is smaller than any rate being considered.  And that doesn't take risk premiums or uncertainty into account, and both of these theoretically push the rate lower.  The risk premium is negative because investments in curbing emissions will pay off most if climate change turns out to be worse than expected.   Weitzman has a nice piece showing why discount rate uncertainty means we should err on the low side.

Given the data, and the basic reasoning here, I was disappointed to see Greenstone brush off the issue so casually. It's the critical question and one that should be continually revisited.

Sunday, September 16, 2012

Tyler Cowen on World Hunger

Tyler Cowen writes about lagging productivity growth in agriculture, headwinds due to the organic/locavore movement, high fertilizer prices and poor infrastructure in Africa, the destructiveness of trade restrictions, the problems with ethanol policy and why we need to give more respect to agricultural economists.   Thanks, Tyler ;-)

Especially if you're in the DC area, be sure to check out Cowen's ethnic dining guide.

Climate change adaptation: Lessons from 2012

Here's David Lobell at the Chicago Council on Global Affairs:
For all of the talk about the need to adapt to climate change, we still know fairly little about two basic questions: what works best, and how much can adaptation deliver? ....
Why don’t we know more? It would be easy to blame our ignorance on complacency. There is a tendency to marvel at the progress made in agriculture in the past 50 years, and assume it can handle anything....

It is also tempting to blame ignorance on inexperience. After all, many people continue to view climate change as something to deal with in the future. But the evidence is clear that climate has already been changing over the past 30 years in most agricultural areas, and farmers are doubtlessly trying to adapt. Up until now, the United States was an exception to that trend. But the 2012 drought has changed that, and projections indicate that years like this will be increasingly common in the coming decades.
.... why was US agriculture not better prepared for the 2012 drought? And did anything work well that can be scaled up?
A lot has changed in US agriculture since the 1988 drought, and many of the changes were textbook examples of what should help to reduce impacts of hot summers. Farmers now sow corn and soybeans more than a week earlier on average, and use longer maturing varieties than in 1988. Advances in cold tolerance along with spring warming trends allowed corn to expand in northern states where temperatures are cooler.... Carbon dioxide levels, which improve crop water use efficiency, have increased by more than 10% since 1988. And farmers have begun to grow drought tolerant seeds that were unavailable in 1988.
Yet when the 2012 drought arrived, with fairly similar characteristics to 1988, impacts on crop yields were roughly the same. Corn yields are expected to be about 25% below trend, close to the 28% drop in 1988.
What can we learn from this experience? It is too early to say anything definitive, but two explanations seem plausible.....
[see link for the rest]

Fed Policy or the Weather?

Stephan Karlson cherry picks August's measure of inflation and writes
the Fed stated that money supply rose 0.3% the latest week alone, causing the annualized 3 month gain to increase to 8.6% and the yearly gain to increase to 7%.
And then the U.S. consumer price index rose 0.6% (annualized 7.4%) in August.
He didn't put the month's inflation numbers in longer-run context, or relative to other measures like the "core" inflation which removes food and energy.  He nevertheless concludes
So, it is clear that unless the European debt crisis again worsens and again causes a surge in demand for dollar  assets, there will be a big increase in price inflation soon.
So, here is a graph that does put August's inflation numbers in context. Blue is monthly percent change in the CPI and red is the monthly percent change "core" CPI, which removes food and energy (which are more volatile).


The two obvious points: (1) the monthly CPI is crazy variable; (2) the recent spike in the CPI was all energy and food; everything else declined.

Maybe, just maybe, the pattern can be explained by the drought and heat we experienced this summer, which caused some big crop losses.  I think it's safe to say monetary policy didn't have much to do with it.

Originally the title to Karlson's post was "Inflation, Inflation, Inflation!" It's a little more tame now. 

Thursday, September 13, 2012

The Fed Pulls the Trigger

Wow.  I didn't think the Fed would do this.  But they did:
“A highly accommodative stance of monetary policy will remain appropriate for a considerable time after the economic recovery strengthens,"
And I'm glad they did it.  It's not inflation targeting or nominal GDP targeting, but it's more-or-less a commitment to be irresponsible.  (I personally don't like that characterization, because I think this is the responsible thing for the Fed to do.)

Anyway, they are testing a big idea here.  We'll see if it works.

Tuesday, September 4, 2012

Why is FAO's food price index up only 6% ?

In today's NYT, we have a report about a weak monsoon and crop devastation in India:
"Drought has devastated crops around the world this year, including corn and soybeans in the United States, wheat in Russia and Australia and soybeans in Brazil and Argentina. This has contributed to a 6 percent rise in global food prices from June to July, according to United Nations data"
Corn is up about 60 percent since June, wheat and soybeans are up respectively about 25 and 16 percent.  The production weighted average of these three crops usually tracks the FAO index pretty well.  Here's a plot of US prices for these three key staples and FAO's food price index. (I made this graph a little while ago, so it doesn't include last month's spike.)

So why is FAO food price index up just 6% (the implicit reference in the NYT article) given the much larger spikes in corn, soybeans and wheat?

Rice prices--another key staple--remains subdued due to large inventory buildups in India and other places.

Still, I don't get it.

I hope this means the world is dealing with crop shortfalls better than in 2008.  Maybe other relatively minor crops are making up the difference. But I wonder if it's just a matter of time before the FAO index shows a larger spike as well.

Saturday, September 1, 2012

Does the Fed really have a commitment problem?

This is a followup to my last post:

Here is a more nuanced explanation of Krugman's views on monetary stimulus at the zero lower bound, which I think I had already understood and mostly agree with.  I differ from Krugman (with admittedly little authority) in thinking that it shouldn't be hard for the Fed to make a credible commitment to future easing if they wanted to.  If Bernanke said the word, and explained precisely how he would do it, I believe markets would respond immediately, and the broader economy wouldn't be far behind.  Continued market movements in response to Bernanke's leanings are a hint of that influence.

Yes, it's true, if Bernanke did it Congress would howl in protest and haul him up to Capital Hill and berate him for debasing the currency, etc.  So?  They're doing that anyway. And if Romney wins Bernanke will lose his job and his influence anyway, despite being a Republican.

A long time ago (almost 2 years!) I explained my reasoning about the commitment issue.  I was similarly befuddled by Robert Hall's take on it.  (Also see the update at the bottom of this post.)

The political, intellectual and philosophical obstacles of what Krugman describes as the "first stage" strike me as the greater challenge, which is why I was critical early on about his discussing this less than stimulus. It seemed to me that stimulus of the necessary magnitude was never politically viable, and Krugman had more sway with intellectuals---the FOMC---than with political calculations around stimulus.  And he can use his fabulous writing skill and wide influence to explain the issue to the broader public.  His magazine piece seemed to shift toward this emphasis.  But that was just six months ago.

Friday, August 31, 2012

Markets still react to Bernanke

Okay, I'm going to briefly weigh in again where I probably shouldn't---the macro situation.

Apparently in response to Bernanke's speech in Jackson Hole today, the stock market and treasury bills rallied modestly, and the 10-year T-bill rate fell over 6 basis points.  I suppose one could argue this was due to something else, but I don't see anything other explanation in the news.

Paul Krugman summarized Bernake's speech as:
1. Things are really, really bad.
2. The damage is cumulative; the longer this goes on, the worse the prospects for the future.
3. The Fed has the power to do a lot to help the economy.
4. While you can argue that there are costs to action, the case for major costs is quite weak, and in particular much weaker than the case for major benefits.
5. Therefore, what we at the Fed will do is, um, sit on our hands some more, and think very seriously about maybe, someday, doing something.
While Krugman greatly supports the Fed trying to do more, he has also expressed skepticism that they can help much when the economy is at the zero lower bound.

But I'd just like to point out that the market still seems to respond to Bernanke's most demure suggestions.  I mean, how much news was there in his Jackson Hole speech?  We all more-or-less knew that the Fed was looking to do more imminently anyway, and now he's nudged another inch in that direction.

If we extrapolate from this, I think it suggests the Fed can do a lot more.  It could do this by changing market expectations, by replacing point 5 in Krugman's summary with a clear and firm commitment for the next X years.  That commitment could be to hold rates where they are for a longer period of time, to target a higher long-run inflation rate,  a commitment to hold rates low until unemployment falls to 6 percent, or a commitment to achieve trend nominal GDP.

I don't think it matters much which commitment they choose.  But I believe that if the Fed were to make a bold commitment of continued easing the economy would recover quickly. It's a shame they probably won't do that.

Update: Slight clarification: I expect the Fed will do something, but whatever they do will be relatively modest.  Perhaps there will be more asset purchases or something.  But I rather doubt we'll see a strong commitment to longer term policy.

Monday, August 27, 2012

Brad Plumber writes what I think about the drought

Brad Plumber over at Ezra Klein's Wonkblog writes my thoughts better than I do :-)

While my comments about CAFO's in my post the other day are sure to offend many, I did try to choose my words carefully.  There are many ethical and environmental issues that surround CAFOs, and I'm not dismissing those issues. 

But we should be aware of indirect consequences of CAFOs.  Some of those indirect consequences can be good for feeding the world and even good for the environment.  It's only responsible to spell out all of those tradeoffs, and I see that as my job. There are good arguments to be made that modern industrial agriculture is good for the environment in much the same way as high-density urban living is good for the environment: by concentrating these activities we leave less of a footprint on the planet as a whole.

Incidentally, unlike the other guy in the news these days, I think "wonk" suits Wonkblog very well.

Sea Ice Extent

Sea ice extent is one of the more interesting barometers of climate change.

This year has been a record low, beating the previous record from 2007.  Extent is a little more than half the 1979-2000 median, or about 6 standard deviations below it.


From Justin Gillis's article today in the NYT:

“It’s hard even for people like me to believe, to see that climate change is actually doing what our worst fears dictated,” said Jennifer A. Francis, a Rutgers University scientist who studies the effect of sea ice on weather patterns. “It’s starting to give me chills, to tell you the truth.”....
....“It’s an example of how uncertainty is not our friend when it comes to climate-change risk,” said Michael E. Mann, a climate scientist at Pennsylvania State University. “In this case, the models were almost certainly too conservative in the changes they were projecting, probably because of important missing physics.”

Saturday, August 25, 2012

What's the price of corn in your meat? Less than you think.

In my OpEd last week I had a lot of back and fourth with the editor.  I probably had too many statistics and my first draft was just too long.  I also should have provided background information up front for the statistics I wanted to present.

One thing that got dropped in the process was an explanation for why retail food prices will rise so little even though corn prices have increased 60 percent.  So much of our food is ultimately derived from corn, or from other commodities like wheat and soybeans whose prices track corn prices fairly closely.  But it still makes little difference.

Take meat, for example.  There are only 3-5 pounds of corn used to make an additional pound of beef, and between 2 and 3 pounds of corn for a pound of chicken or pork.   The calculation isn't particularly straightforward, but these numbers are probably about right ``on the margin," as economists like to say. This can vary a bit from operation to operation or how it's measured, but feed use efficiency has risen a lot over the last couple decades with the growth of confined animal feeding operations, or CAFOs.

Let's says 5 pounds of corn per pound of meat.  There are 56 pounds of corn in a bushel and since June prices have increased from about $5 to about $8 per bushel.  This means the amount corn in your quarter-pound burger have increased from about 11 cents to about 18 cents.  If there is market power by processing companies or retailers, retail prices would go up by less than this amount (this is basic microeconomics, but I'll save the details for another time).  So, you'll have to squint to see the effect of this year's drought on prices at grocery stores and restaurants.

There are lots of complaints about CAFOs being inhumane for animals.  That may be, but they are also extremely efficient at using resources.  Without CAFOs, you would see bigger prices in all kinds of food, and this year's heat and drought would have caused a larger price spike.  We would also be using more land in crop production globally, and be using more fertilizers that pollute water and all manner of other environmental problems that follow from crop production.  Many environmentalists don't like CAFO's but they may well be doing more good for the environment than eating grass-fed beef, unless the high price of grass fed beef causes you to eat less.  (Granted, grass-fed beef is probably healthier.)

Anyhow, the main point is that commodities are a tiny share of retail prices in developed economies.  Prices of most everything, including food, is made up primarily of labor and capital costs, plus rents to producers and retailers with market power.  The big concern for high commodity prices in the developed world where the commodity share of food expenditures is much, much greater and people spend a much larger share of their income on food.

(cross posted at G-FEED)

Monday, August 13, 2012

Are we coping with extreme heat better than the past?

I'm live at CNN.  This is the biggest splash I've ever had....

Extreme heat and droughts -- a recipe for world food woes

With extreme heat and the worst drought in half a century continuing to plague the farm states, there are important lessons to be learned for all of us -- farmers, consumers and the world's poorest populations alike -- about the effect of climate change.

The Agriculture Department announced this season's first major crop yield forecasts, and they weren't pretty: a nationwide average of 123.4 bushels of corn per acre, the lowest level since 1995. Soybean yield is expected to be low too, though not as bad as corn.

The United States, which is the world's largest producer and exporter of staple grains, is grappling with the biggest surprise in production shortfalls since the Dust Bowl of the 1930s. Certainly, this July surpassed July 1936 as the hottest month on record

So, how will the devastation affect U.S. crop farmers? .....

Saturday, August 11, 2012

Forecasting Corn Yields

My colleague Wolfram Schlenker has developed forecasts for this year's corn yield based on weather through August 6.  We've been considered pessimists by some, since this model predicts really big declines in crop yields under projected climate change.  But this year we're the optimists: our model predicts a US yield only a 14 percent below trend. That's bad, but it's not nearly as bad as USDA's forecast last Friday of 25 percent below trend.

I'm replicating his post so you don't have to click through:
USDA today announced its forecast for corn yields. It might be fun to compare those forecast to one using a statistical model of corn yields that my colleague Michael Roberts and I have developed. It uses only four temperature variables (two temperature and two precipitation variables - if you want to read more, here's a link to the paper). The temperature variables in 2012 are shown here.

All weather variables in the model are season totals for March 1st - August 31st. The following graph combines actual weather observations for March 1st-August 6, 2012 with historic averages for August 7th-August 31st in each county.  Once the actual weather for the rest of August is realized, the predictions will obviously change dependent on whether it warmer or cooler than usual.

Thursday, August 2, 2012

Should the Ethanol Mandate be Temporarily Suspended?

There seems to be a big push to roll back the ethanol mandate, at least temporarily, due to the crop losses and high prices for corn, soybeans and wheat we're experiencing this year.  See, for example, Colin Carter and Henry Miller's Op Ed in the New York Times.

How much would a temporary suspension of the mandate affect prices?

As I write, the future price for corn delivered in December 2012 is $7.95/bu.  The price for delivery in December 2013 is just $6.30.  So, there is no incentive to store commodities, and inventories are very low.  So, any reprieve on the demand side will push directly on this year's price. With regard to prices, it would be equivalent to reducing the size of crop losses.  If we lose 1/3 of the crop from heat and drought, and we reduce demand by 1/3 by temporarily halting ethanol production, we'd probably go back to early-Spring prices of around $4-5/bu.

One problem with this back-of-the-envelope calculation is that ethanol production is unlikely to stop completely just due to a temporary suspension of the mandate.  There are shutdown and startup costs, and a 10% ethanol blend is firmly in place.  So prices probably wouldn't fall back that far, but they would fall a lot.

In fact, I wouldn't be surprised if speculation about a temporary suspension of the mandate is already  folded into futures prices, at least partly.  It's hard to know what the odds of a repeal might be, but the market knows it's not zero.  And the worse are crop losses, the greater the odds of a temporary  suspension.

What's more subtle and potentially more interesting is that temporarily repealing the mandate would set a precedent that would affect futures prices and inventory demand going forward.  It would be interesting to evaluate an ethanol policy with a "safety valve" that would relax the mandate in the event prices exceeded some threshold.  This kind of analysis is more difficult. Nam Tran, a grad student at NCSU, is working on it.  I'll post his results here if and when he has them.

(Cross-posted on G-FEED)

Friday, July 27, 2012

A New Normal?

Over at G-FEED, short for Global Food, Environment and Economics Dynamics,  a new site and blog by an interdisciplinary group of scholars, David Lobell has offered his first post in which he considers whether this summer's heat wave is "the new normal."

I've done rough back-of-the-envelope extrapolations from earlier work that suggest, with respect to temperatures, this summer will be the new normal (average or expected outcome) in about 10-15 years.  Rainfall is a different story, but check out G-FEED...

Thursday, July 26, 2012

David Lobell on World News with Diane Sawyer

Last night my colleague David Lobell was on World News with Diane Sawyer.


video platformvideo managementvideo solutionsvideo player

Tracking the Heat and Drought

Most commentators attribute this year's bad crop progress with drought--a lack of rainfall.  The problem with traditional drought measures is that they don't predict crop outcomes especially well.  Our measure of extreme heat--degree days above 29C--predicts crop outcomes a lot better.

Extreme heat is correlated with traditional drought measures, but only very roughly.  But it probably has a stronger association with water stress in plants, since there tends to more evaporation and evapotransporation when it's very hot (vapor pressure deficit increases).  Also, heat can have its own direct damaging effects on plants.

So, here's the current situation for extreme heat and precipitation the US relative to history since 1960.  We obtain a single nationwide index by weighting counties by trend production.  County level measures are derived from our own daily fine-scale (4km grid) weather data, which combines PRISM monthly data with daily weather station data.


These plots were generated by my colleague Wolfram Schlenker.  We're also going to start cross-posting at our joint site G-FEED, a group that includes Wolfram as well as David Lobell, Solomon Hsiang and Jarrod Welch.

The gray lines show earlier years, the hottest prior to this year being 1988 and 1983, which had really bad crop outcomes.  The driest year was also 1988; but 1983 is one of the lines in the middle somewhere.

From the extreme heat measure, it looks like we're on track for the worst yield outcome (relative to trend) in over 50 years. Precipitation doesn't look quite as bad, but close.

One key feature that I think makes this year especially bad:  the slope of the extreme heat line during the month of July appears to be the steepest on record while the precip line for July appears to be the shallowest on record.  This could turn out a good bit worse than 1988.

Wednesday, July 25, 2012

Actually, it's not Obamacare for Our Corn

It was a great line by Steven Colbert and Bruce Babcock.  But it's not true.  Federal crop insurance has way more Big Government and a lot less efficiency than Obamacare.

A few differences:

1. Obamacare has subsidies for low-income households; crop insurance has huge subsidies for all the farmers, regardless of farm size or farm household wealth.

2. Obamacare lets the private market determine premiums and pay indemnities; crop insurance policies and premiums are all set by the government, and the government pays most indemnities, with private insurance companies basically getting fat commissions for marketing government policies.

3. Obamacare requires everyone be insured, which forces pooling; crop insurance isn't mandatory, so they have to just crank up the subsidies.  In 1995 they tried to require enrollment in the insurance program in order to qualify for other kinds of subsidies, but farmers complained and so they rolled back this requirement.  They've also threatened many times not to give disaster assistance unless farmers are insured, but usually they give farmers disaster payments regardless of whether they insure.

But like health insurance, crop insurance wouldn't exist without government involvement.

It will be interesting to see how big those indemnity checks will be this year.

Heat, Drought and the Cattle Cycle

News coverage of crop losses has actually has been pretty good. It has emphasized losses for consumers and gains for farmers, who are insured and get higher prices.

But why do they always call it drought?  I know rainfall is well below normal, but it's the heat too.

One interesting thing that I think I've brought up before on this blog:  In the short run meat prices can actually fall, as livestock farmers cull herds and some of their breeding stock.  Of course that blip in extra supply means less future supply and higher prices next year.  The resulting "cattle cycle" was historically emphasized by freshwater macro types looking for fundamental causes for business cycles.  I'll leave it to you to decide whether cattle cycles bear any resemblance to the macroeconomic business cycle we're currently experiencing.

Since the lifecycle is shorter, chicken prices will rise sooner, as will eggs and dairy products.  Retail price increases won't be huge, though.  Retail prices are still mostly made up of labor and transportation costs.

Obamacare for Our Corn

This has to be the funnest thing an agricultural economist could ever do...

Great job Bruce!

 The Colbert ReportMon - Thurs 11:30pm / 10:30c
U.S. Agriculture & Drought Disaster - Bruce Babcock
www.colbertnation.com
Colbert Report Full EpisodesPolitical Humor & Satire BlogVideo Archive

Monday, July 23, 2012

Fingerprinting Climate Change

I'd like to think I helped inspire Krugman to write his column today, since he linked here the other day from his blog.  Hardly anyone reads this thing, but if the right people read it, maybe it can have some second-hand impact?  This and my slightly easing schedule inspires me to try getting back to it.

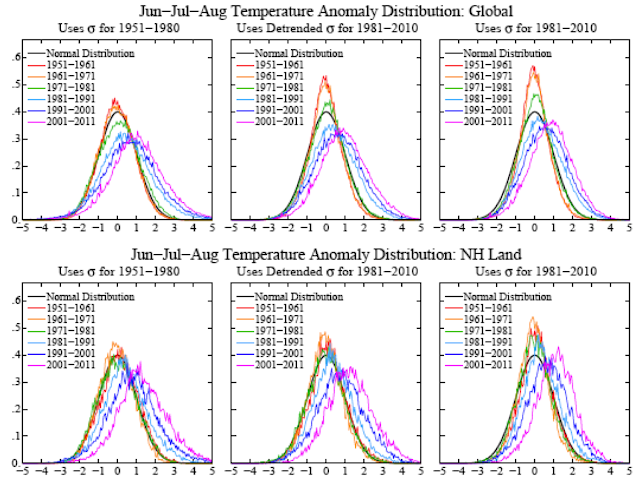
Hansen's climate dice paper shows how much the relative frequency of extremely warm temperatures has increased.  But how is it that scientists know warming is due to greenhouse gas concentrations (primarily CO2)?

Earlier this summer I got to attend a workshop in Banff on climate change detection and attribution, a research area dedicated to precisely this question.  Besides a few token impacts guys like myself, the workshop was attended mainly by top people in detection and attribution.  It was interesting for me to see the technical side of this, which basically involves some sophisticated statistical modelling.

The basic idea is to look at how the "fingerprint" of warming matches the core predictions of the various climate models.  This fingerprint includes much more than the amount of surface-temperature global warming.  They pay attention to the pattern of warming across different latitudes.  The climate models predict more surface warming in the polar regions and especially the north, as compared to equatorial regions. Most compelling to my mind, is the fingerprint of predicted warming and cooling in different layers of the atmosphere.   Unique to greenhouse gas emissions, the models actually predict cooling in the lower stratosphere, but more warming in the upper troposphere in equatorial latitudes.  I understand physicists predicted this distinct fingerprint before they had even begun measuring temperatures throughout the troposphere and stratosphere. 

Here is a picture from Ben Santer's talk that illustrates the model-predicted pattern of warming from GHG in comparison to other factors that might cause warming.


And here's what data on actual warming look like:


In a nutshell, this is why the real climate scientists--about 97% of them--are not only convinced that climate change is real, but that it is due to greenhouse gas emissions and is human induced.
(If you dig around the link to the workshop you can find a video of my talk on agricultural impacts....)

Friday, July 20, 2012

The Heat: Is it Weather or is it Climate Change?

Update 2: Even more kudos to Krugman for linking here and expanding on my first point.  It's amazing what a link from him does to visit numbers on this little ol' blog.

Update: Kudos to Paul Krugman to drawing attention to the issue.

So, the Midwest is getting crushed by heat and drought, and crop prices are reaching new record highs.

I'm a little depressed but not at all surprised by this.  But that sentiment kind of matches everything in our economic, political and environmental world.  Aside from some major life changes and general busyness, it's probably a reason I haven't been blogging much---there's really not much to say that hasn't already been said many times.

Anyhow, to reiterate a few basic points:

1. The usual politically-correct line is that we cannot tell whether its weather or climate change.  The weather fluctuates and heat waves happen. But the data show that the relative frequency of extreme events like this has increased tremendously.  Just look a few posts back or read Jim Hansen's Climate Dice paper (PDF).  Statistically speaking, this is almost surely climate change.

2. This kind of heat for the US Midwest is already past due. I haven't crunched this season's numbers yet, but eyeballing it, this summer--about like 1988--is probably about what we should expect to be typical in the relatively near future.

3. Some new 'drought tolerant' varieties were rolled out this year. I guess we'll see how they do.  So far it seems markets are not all that impressed.

4. Don't cry for the farmers.  Prices are going up proportionately way more than yields will go down, so farm income is likely to rise on average.  And besides, they have a sweetheart deal on subsidized crop insurance.  Then they'll get disaster payments.  Unlike health care and education for poor children, safety nets for wealthy farmers has always been a prerogative with happy bipartisan support. There are probably a few farmers out there that will get hurt by this, but far more farmers will get  richer off this heat and drought than go bankrupt.

5. The biggest losers are consumers, especially the poor in food-importing developing countries.

Wednesday, May 16, 2012

Remarkable Growth in Extreme Summer Heat--Except the Corn Belt

In my last post I suggested we've been lucky so far when in comes to weather in the crucial corn belt region.  Although temperatures have been rising, at least in the corn belt during the key summer months, it's been relatively temperate.

I've just gained new appreciation for how lucky we've been.

I found these charts in a draft paper (PDF) by Jim Hansen and coauthors.  They show a remarkable shift in recent decades in the incidence of extreme temperatures, especially over land in the northern hemisphere (the bottom three charts in the first panel of six). The shift in summer temperatures in just the last two decades is tremendous.  The frequency of "very hot" temperatures has more than tripled (bottom-right chart, in the second panel of six). 

I can see 1983 and 1988, the most recent two hot years that killed crop production in the crucial corn belt region. And while the whole northern hemisphere has seen a lot more very hot temperatures since then, luckily that hasn't happened in the places it matters most for food production.

I fear the next decade is about to get very interesting...

Wednesday, May 9, 2012

Warmest Consective 12 Months on US Record

Well, at long last I venture another blog post.  We'll see if I can keep this going...

I think most people noticed the warm winter and spring.  Now we have official statistics:  via Climate Progress and WunderBlog, we've just experience the warmest 12 consecutive months on record in the United States, and by far the warmest January through April temperature anomaly on record. 


This kind of warming in Spring will probably turn out to be good for agriculture.  It lengthens the growing season, allowing farmers to plant earlier.

The bad side of warming comes in summer months.  Interestingly, we *still* haven't had especially warm weather during the critical summer months in the key crop-growing regions.  The last two summers were warm, but just a little warmer than average, according to our own extreme-heat degree-day calculations.  Here are some figures my colleague Wolfram Schlenker recently put together for degree days above 29C, our measure of extreme heat, in corn-growing areas between March and August.  Both 2010 and 2011 were above average, but not by much.  And based on the evidence we have, the 1930s were a lot hotter than 1988.


My take on this is that we've been lucky.  Tack this winter/spring weather anomaly onto historical mid-summer temperatures and agricultural production will take a huge hit.  Farmers won't do badly at all, since they're mostly insured anyway and commodity prices will soar.  But high prices would exacerbate the global food crisis. 

Maybe, if we're really lucky, warming will continue in manner that affects Winter and Spring more than Summer.  But I don't think we can count on that, and I don't think it's what climate models are generally predicting. 

It might also be true that crops are becoming more tolerant to extreme heat.  Last summer was unusually wet in the corn belt just before the heat wave struck, which may be why yields weren't hit as badly as we might have expected.  Even so, yields were only slightly better than our model predicted.  Here's a plot of those predictions that Wolfram put together.


Renewable energy not as costly as some think

The other day Marshall and Sol took on Bjorn Lomborg for ignoring the benefits of curbing greenhouse gas emissions.  Indeed.  But Bjorn, am...